New in Swift 6: a macro to make debugging easier
You’re more of a video kind of person? I’ve got you covered! Here’s a video with the same content than this article 🍿
Advertisement
Debug HTTP/HTTPS with Proxyman like a Pro
Try Proxyman, a native macOS app that captures and displays Request/Response in beautiful UIs.
Supports iOS and Android, both devices and simulators.
Get 30% off discount for Black Friday with the code BLACKFRIDAY2024
Sponsors like Proxyman really help me grow my content creation, so if you have time please make sure to check out their survey: it’s a direct support to my content creation ☺️
In this article, I want to show you a nice little addition of Swift 6, that will come in handy the day that you need to debug a complex issue.
Let’s take a look at a simple piece of code.
I’ve created a struct with two properties, then I’ve created a value of that type and finally I’ve set a breakpoint, so that I can look at that value in the debugger:
And as soon as this breakpoint triggers, we indeed see the value in the debugger.
However, if we want to know what’s inside its stored properties, we will need to make a click, to open the value and display its details:
In this simple setup that’s not a big problem.
But what if our type contained a lot of properties and we were only interested in looking at a few?
Or what if we needed to deal with a lot of different variables?
In both of these situations, it would be really convenient if we could have some kind of summary, directly visible at the top level, that would contain all the info that we currently care about, so that we don’t need to look into the details of the value.
Good news: Swift 6 makes it super easy to implement such a summary!
It only takes two simple steps.
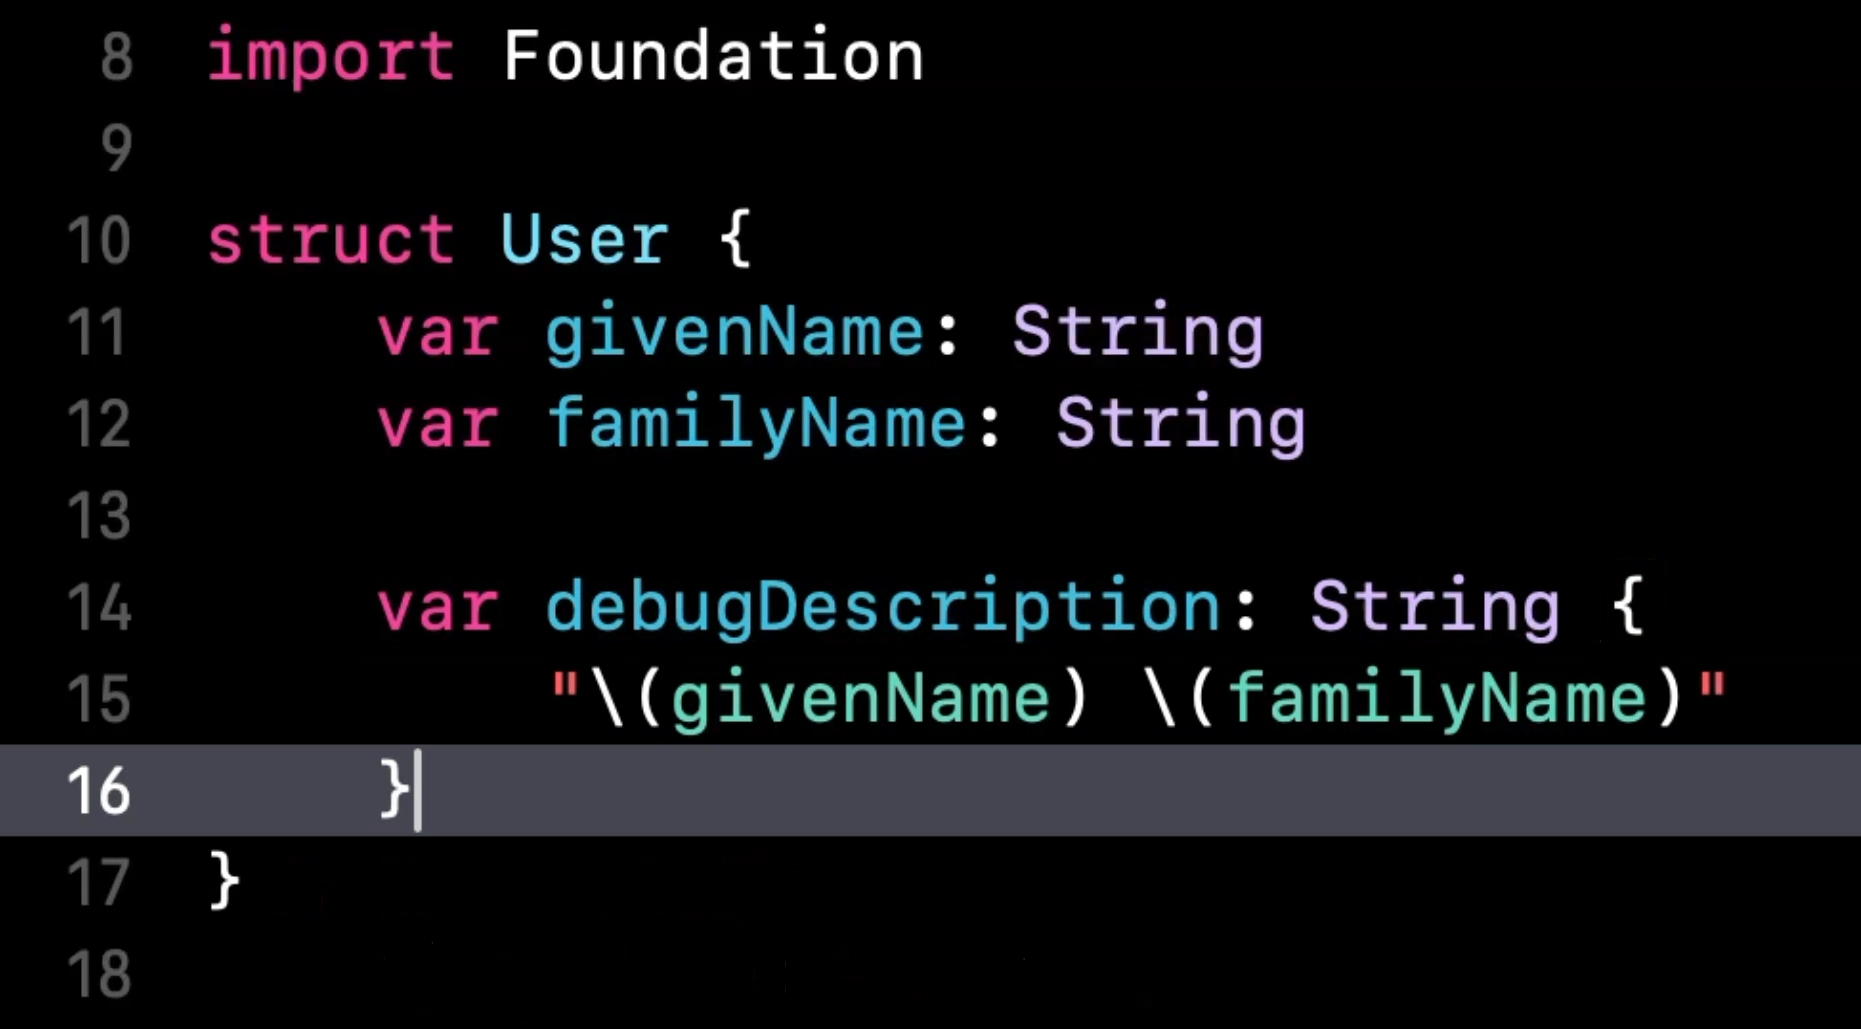
First, implement the property debugDescription and use it to return a String with the info that you currently need:
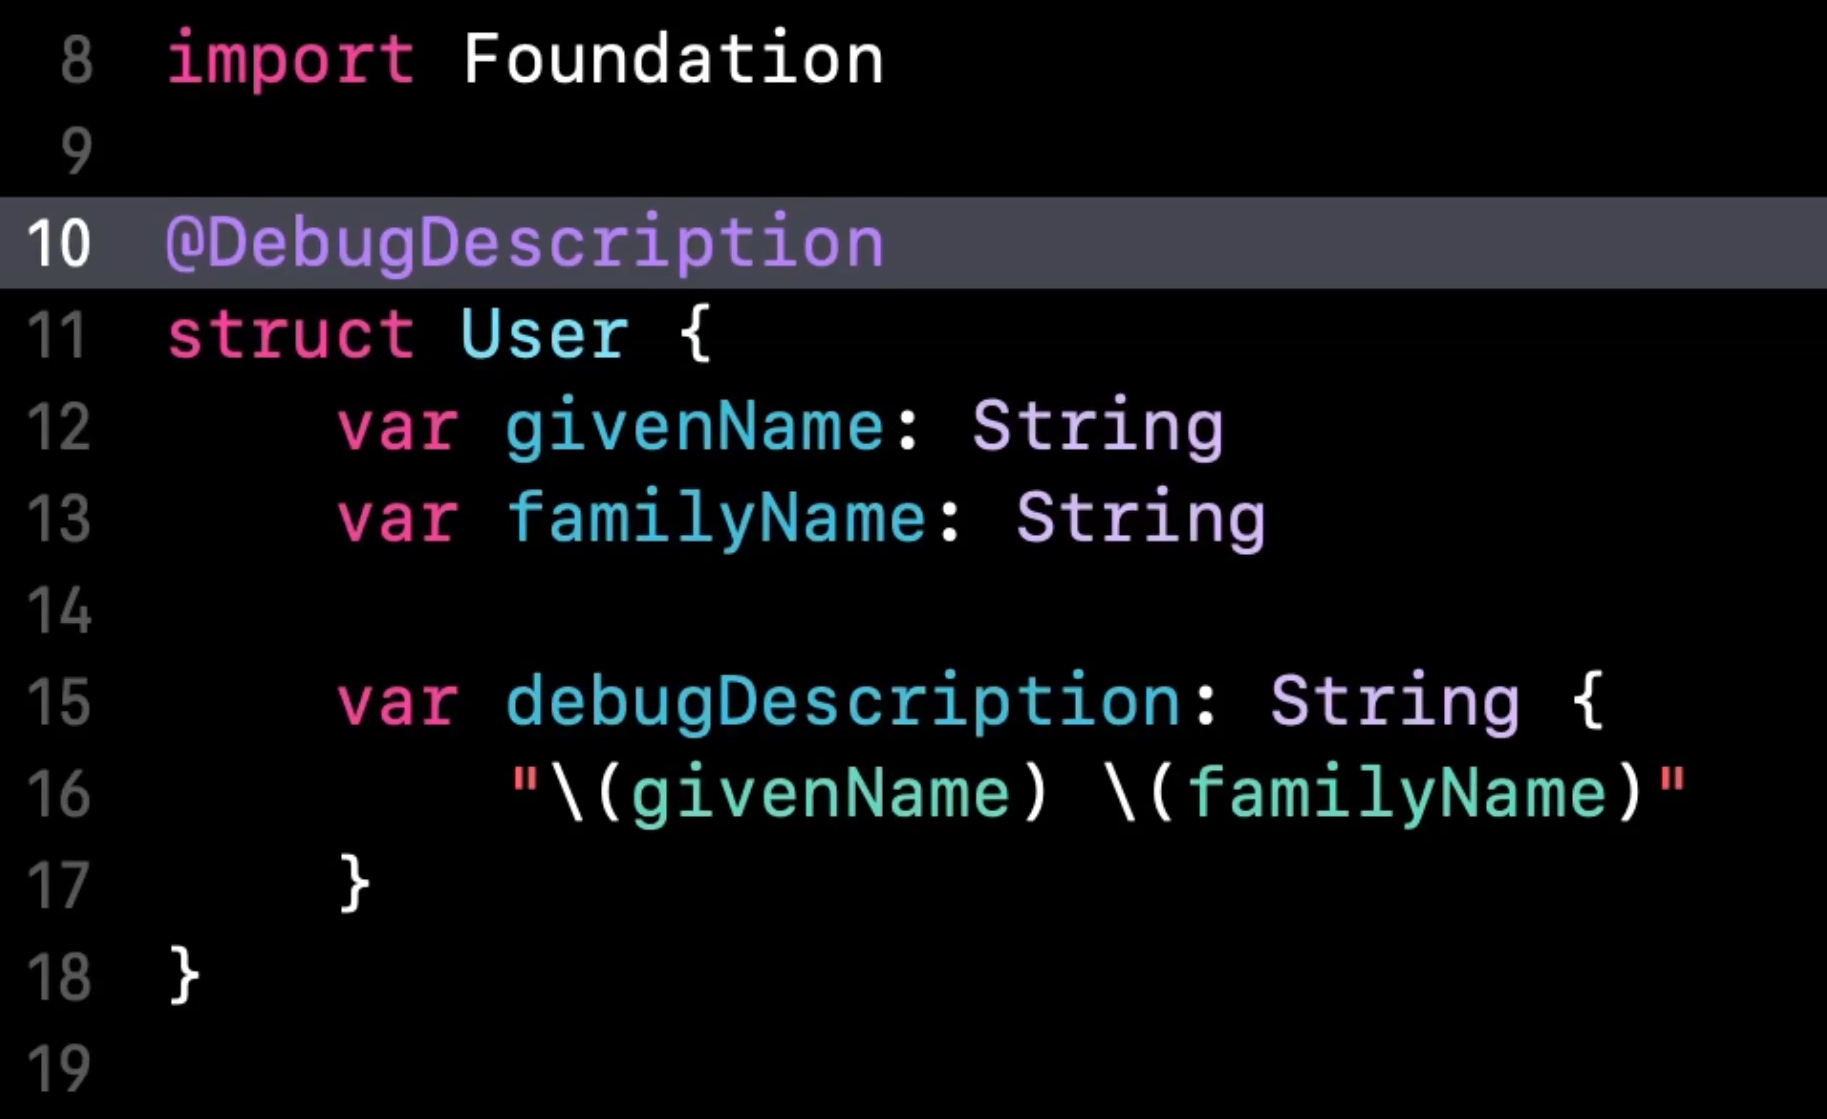
Then annotate the type with the macro @DebugDescription:
And that’s it!
Now if we run the code again, when the breakpoint triggers we can see that we do have our debugDescription visible in the debugger, directly at the top level of the value 👌
If you’re wondering how that works under-the-hood, we can easily find out by expanding the macro:
As you can see, this macro adds some instructions destined to LLDB, which is our debugger, to tell it to show our summary of the type ✌️


